


# Monitoring
By default, the KUDO Kafka Operator comes with the JMX Exporter agent enabled. It also includes a Prometheus Node Exporter sidecar container to export container metrics like the disk usage of persistence volumes used by KUDO Kafka.
When the Kafka operator is deployed with the parameter METRICS_ENABLED=true (which defaults to true) then:
- Each broker bootstraps with the JMX Exporter (opens new window) java agent exposing the metrics at
9094/metrics, along with a Prometheus Node Exporter (opens new window) sidecar exposing container metrics at9096/metrics. - Adds a port named
metricsandne-metricsto the Kafka Service. - Adds a label
kudo.dev/servicemonitor: "true"for the service monitor discovery. - Mounts a config map with metrics reporter (opens new window) for the broker container.
$ kubectl describe svc kafka-svc
...
Port:              metrics  9094/TCP
TargetPort:        9094/TCP
...
Port:              ne-metrics  9096/TCP
TargetPort:        9096/TCP
...
# Using the Prometheus Service Monitor
To use the prometheus service monitor, it's necessary to have installed the prometheus operator (opens new window) previously in the cluster.
Users can monitor the Kafka cluster using independent service monitor. Or use the one that comes with KUDO Kafka
$ kubectl kudo install kafka --instance=kafka-instance -p ADD_SERVICE_MONITOR=true
Or users can provide their own service-monitor. If Kafka is using the default namespace, we can create a service-monitor with the following:
$ kubectl create -f resources/service-monitor.yaml
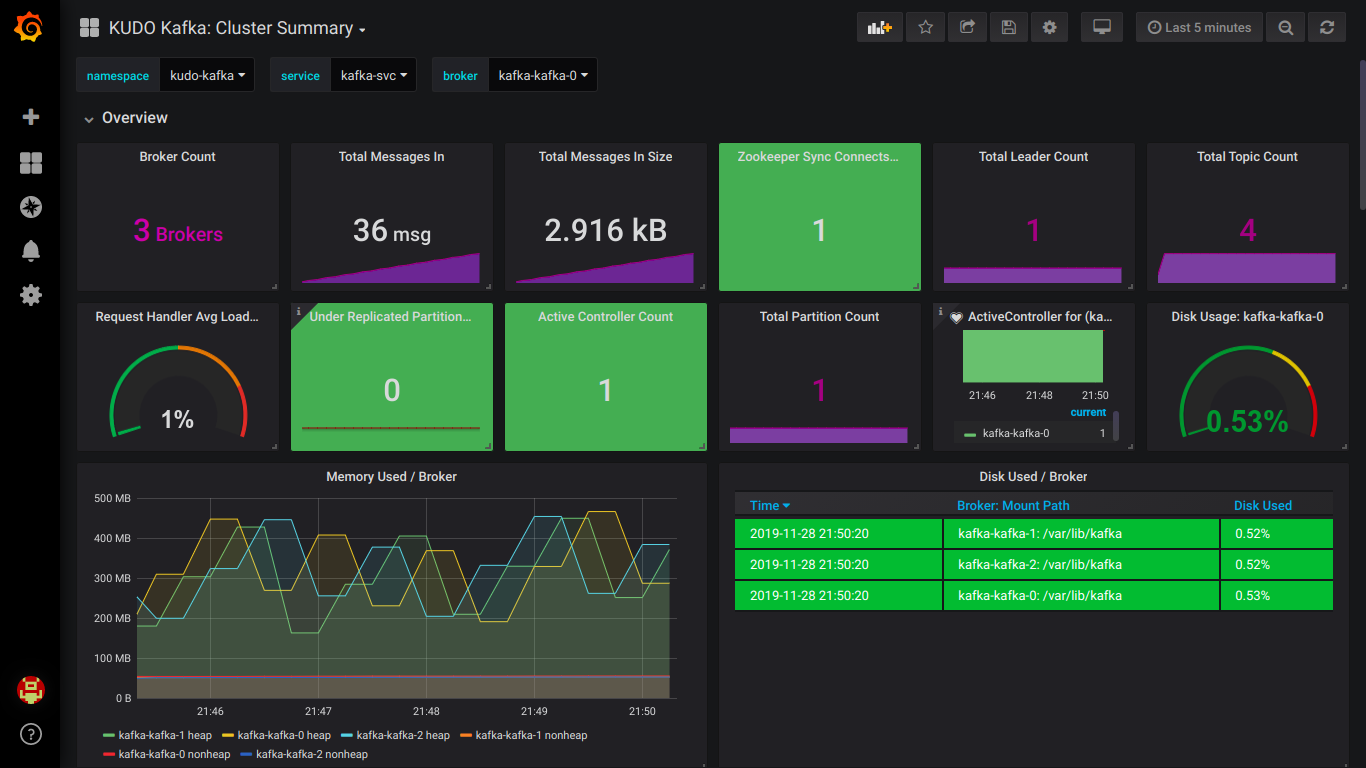
Upload this grafana json and you should see the following Kafka dashboard:
# Disable the metrics
$ kubectl kudo install kafka --instance=kafka-instance --parameter METRICS_ENABLED=false